The right way to choose between REST, GraphQL, and gRPC on AWS

Passionate cloud architect specializing in AWS serverless architectures and infrastructure as code. I help organizations build and scale their cloud infrastructure using modern DevOps practices. With expertise in AWS Lambda, Terraform, and data engineering, I focus on creating efficient, cost-effective solutions. Currently based in the Netherlands, working on projects that push the boundaries of cloud computing and automation.
A working AWS reference, one e-commerce backend deployed three ways, and the ALB configuration that costs people half a day.
Most engineers pick the wrong API protocol. And they have no idea they're doing it.
It's not because they don't know what REST, GraphQL, and gRPC are. They do. The problem is they're asking the wrong question.
"Which protocol is best?" doesn't have an answer. It's like asking which is best — a postcard, a phone call, or shouting across the room. They're all best, at different things. Trying to rank them on a single axis is the source of the confusion.
The right question is who's talking to whom? Once you answer that, the protocol picks itself.
In this post I'm going to walk you through a working AWS reference that demonstrates the idea. One e-commerce backend, deployed three ways, with each protocol living in the architectural layer where it actually belongs. You can clone the repo, deploy it to your AWS account in about fifteen minutes, and tear it down with one command when you're done.
Here's what we'll cover:
A mental model that makes protocol choice obvious in under 10 seconds
The full AWS architecture, component by component, including the ALB configuration that costs people half a day of debugging
Four live demos that make the trade-offs visible: REST + CloudFront caching, gRPC payload size, GraphQL aggregation, and the N+1 trap
A three-question decision rule you can apply to your next endpoint
There's also a 17-minute video walkthrough if you prefer watching to reading — link .
Let's start with the mental model.
Three conversations, three protocols
Imagine you're in a restaurant.
A customer walks up to the counter and orders a coffee. Someone hands them a coffee. Clean, simple, universal — everybody knows how to do this. The downside is that if you want six things, you walk up to the counter six times. That's REST.
A different customer sits at a table and tells the waiter everything they want at once. Coffee, croissant, eggs, juice, bill at the end. One conversation. The waiter goes off and assembles the whole meal. The downside is the waiter has to be good — if they're sloppy, they'll make twelve trips to the kitchen instead of one. That's GraphQL.
And in the kitchen itself, the cooks are shouting tickets at each other. "Two eggs up, pancakes, hold the bacon." Fast, terse, no wasted words. They can do this because they all speak the same shorthand and they're standing five feet apart. Try shouting that at the customer and they'll ask for a manager. That's gRPC.
That's the whole framework. Three different conversations, three different jobs, in the same restaurant. The technical details under each protocol exist to make its specific conversation work well — and to make the wrong conversation painful.
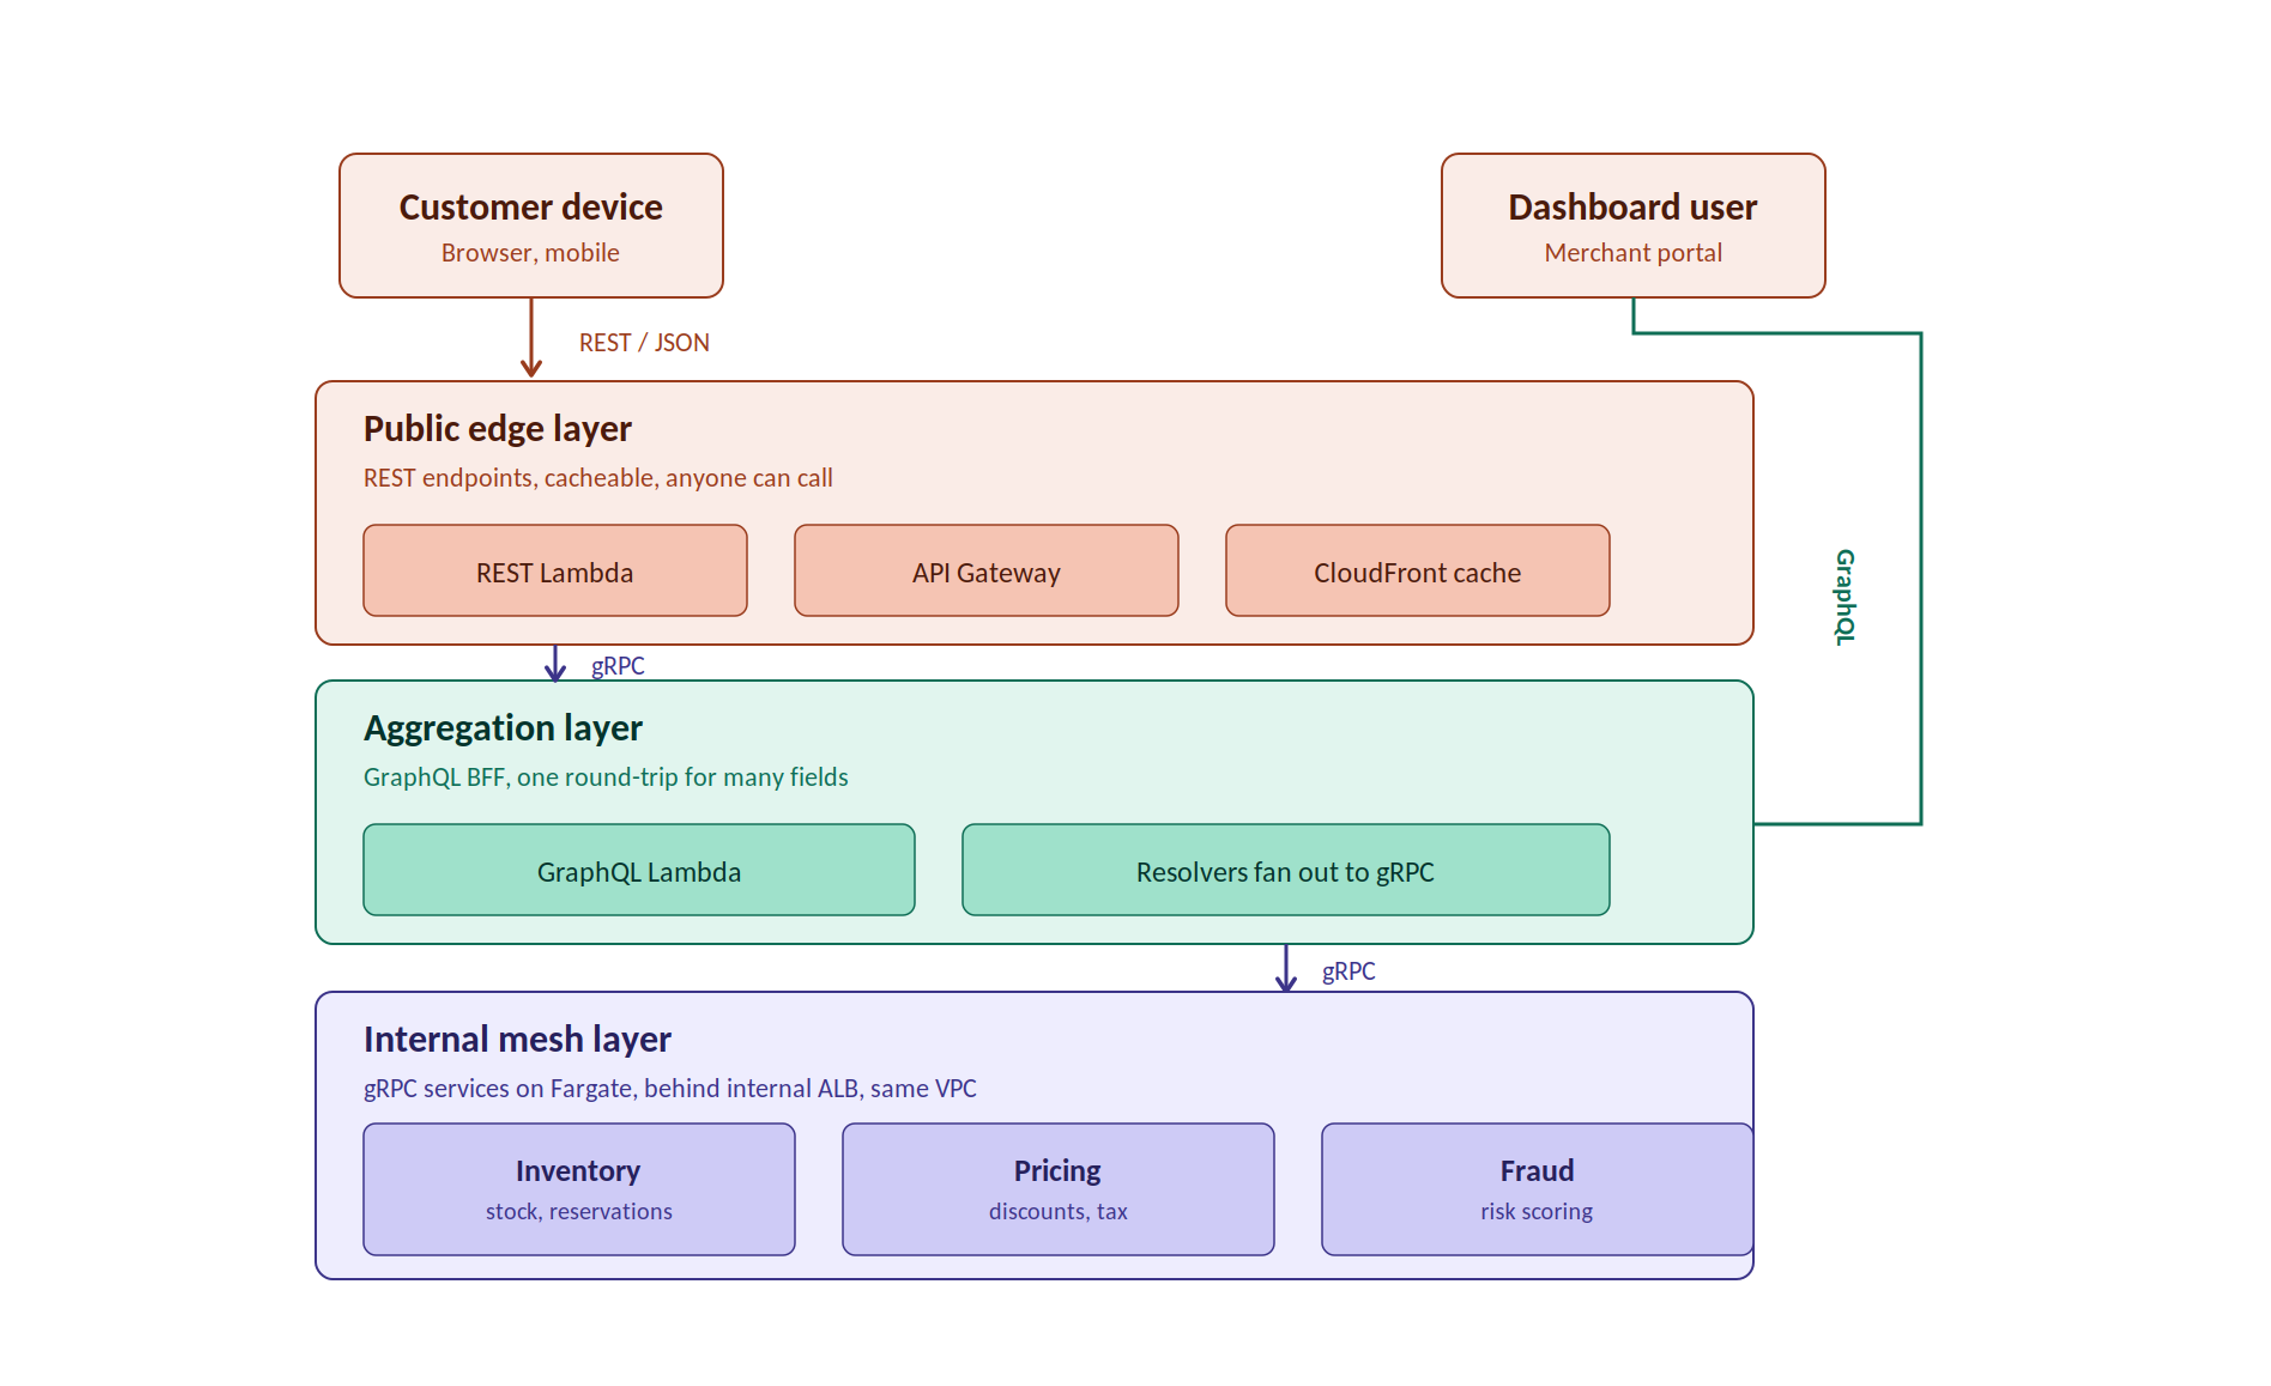
Translated into engineering terms: every protocol decides three things about a message. What it looks like (the wire format — text or binary). What carries it (the transport — HTTP/1.1, HTTP/2, persistent connections). And the shape of the conversation (the contract style — resource-based, function-call, custom query). Pick a different answer to each of those three things and you get a different protocol.
REST answers: JSON text, HTTP/1.1, resource-based. GraphQL answers: JSON text, HTTP/1.1 POST, custom query. gRPC answers: binary Protobuf, HTTP/2, function calls.
Three sets of answers. Three places where each set works beautifully — and three places where it doesn't.
The example application: OrderFlow
To make this concrete, I built a small e-commerce backend called OrderFlow. It's a teaching reference, not a production system, but it does three things every real e-commerce backend does.
A customer on their phone places an order. That's a public API call — anyone with the URL can hit it. It needs to be cacheable, debuggable, and universal.
A merchant on their laptop opens a dashboard that pulls the order, the customer who placed it, the line items, the pricing, and a fraud assessment — all on one screen. One UI, multiple sources, mobile network probably. It needs one round-trip instead of six.
And inside the system, three internal services talk to each other constantly. Inventory checks stock and reserves items. Pricing calculates totals with tax and discounts. Fraud scores the order for risk. They all live inside the same VPC, talking thousands of times a second.
Three different jobs. Three different conversations. And here's the central claim of this whole post: each conversation has a protocol that fits it best — and the architecture I'm about to walk you through deploys exactly that.
The AWS architecture
Here's the picture. Every component lives in a single AWS account in eu-central-1, deployed with AWS CDK in Python.
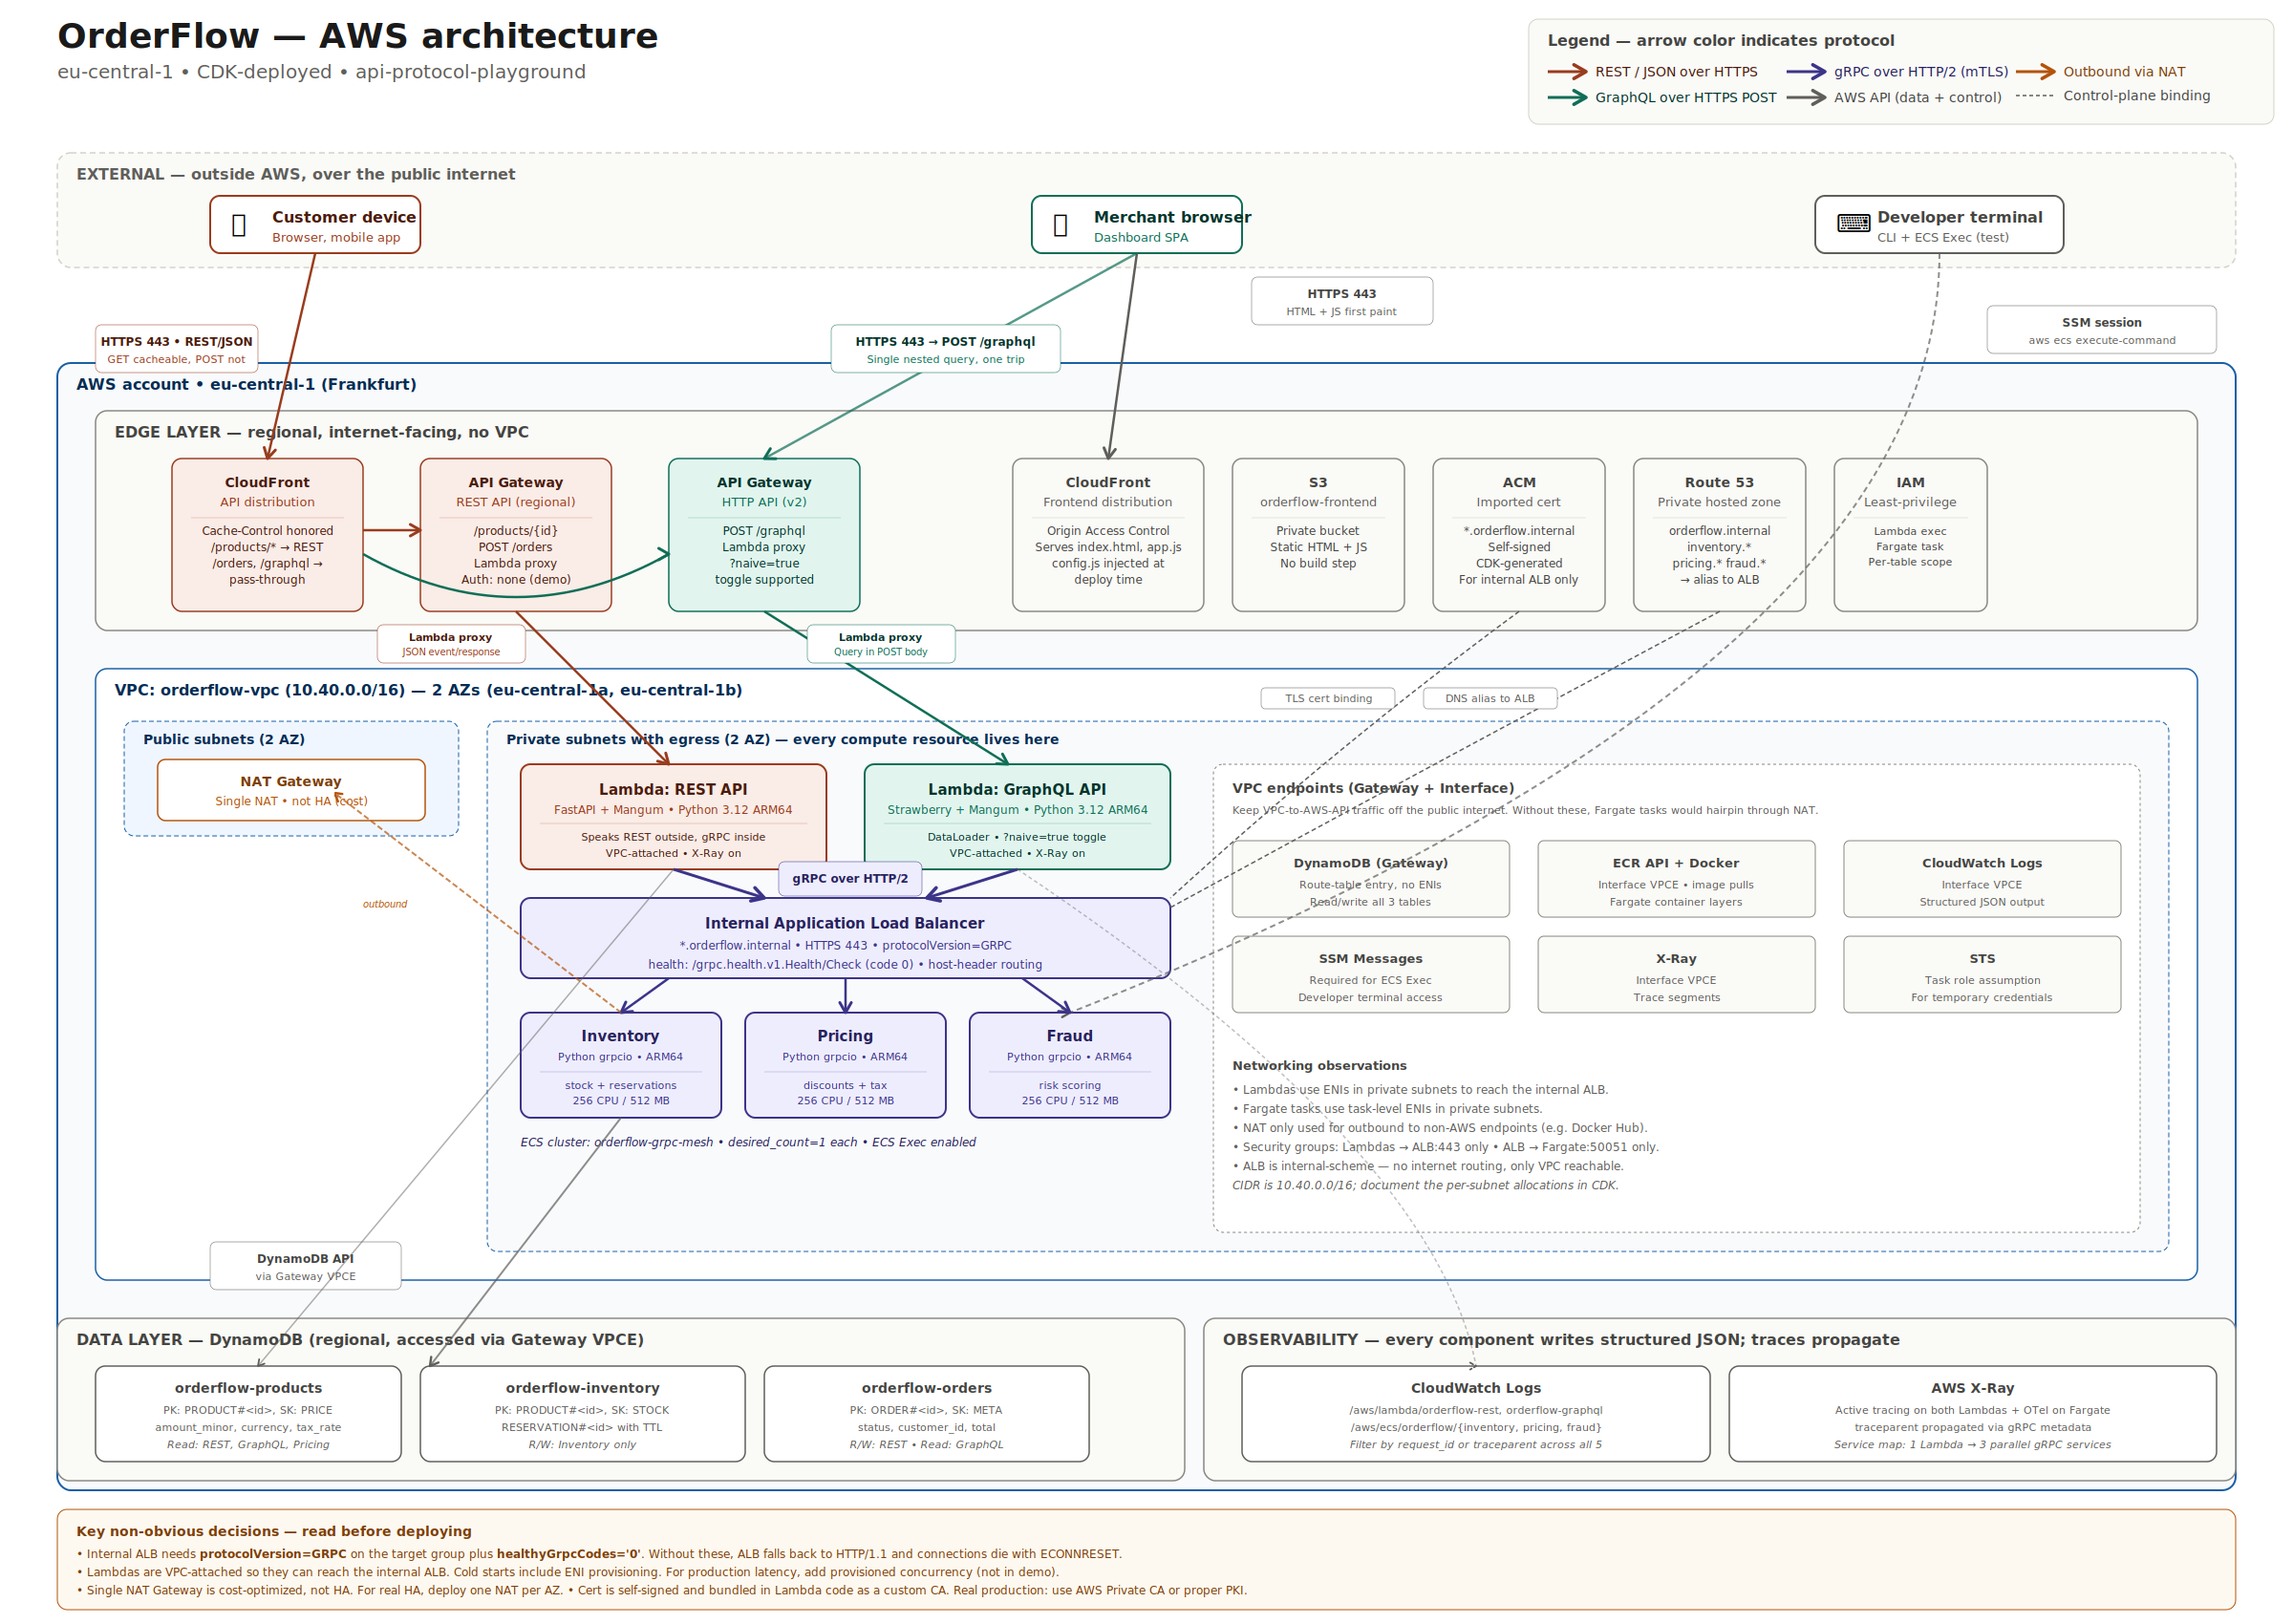
Working from the top down:
The edge — two CloudFront distributions
There are two CloudFront distributions in this architecture, not one. The API distribution sits in front of API Gateway and honours origin cache-control headers — it caches what's allowed to be cached, and passes through what isn't. The frontend distribution sits in front of an S3 bucket holding the static HTML and JavaScript, and caches everything for hours.
Folding them into one distribution is technically possible. You end up writing weird path-based exception rules to make it work. Two distributions is cleaner and only marginally more expensive.
Two API Gateway flavours
Below CloudFront, there are two API Gateways — and they're deliberately different products. The REST API Gateway sits in front of the FastAPI Lambda. The HTTP API Gateway (the newer v2 product) sits in front of the Strawberry GraphQL Lambda.
Why two? Because the newer HTTP API is faster, cheaper, and simpler — about 70% cheaper per million requests than the older REST API Gateway. But it doesn't have some features the REST API Gateway does, like API keys, usage plans, and request validation. So I used the lighter product where I could, and the heavier product where I needed its features.
This is a real architectural choice you'll make a lot. Default to HTTP API unless something specifically forces you to REST API.
Lambdas inside the VPC — and what that costs
Both Lambdas — the REST one and the GraphQL one — live inside private subnets of the VPC.
This is a deliberate trade-off, and senior engineers will spot it immediately. Lambdas usually live outside the VPC because they start up faster that way. But these Lambdas have to reach the internal ALB, and the internal ALB only exists in private subnets. So I put the Lambdas inside the VPC and paid for it with slower cold starts — the first time a Lambda runs after being idle, it needs about a second to provision an ENI before it can execute.
For a teaching demo, that's fine. For a production product where the first user shouldn't wait a second, you'd add provisioned concurrency — a feature that keeps a configured number of Lambdas warm and ready.
The internal ALB — the keystone configuration
This is where the most useful piece of trivia in this whole project lives.
The load balancer in front of the gRPC services has to know it's speaking gRPC, not regular HTTP. There are two specific CDK settings that make this work:
from aws_cdk import aws_elasticloadbalancingv2 as elbv2

inventory_target_group = elbv2.ApplicationTargetGroup(
    self, "InventoryTargetGroup",
    vpc=vpc,
    port=50051,
    protocol=elbv2.ApplicationProtocol.HTTPS,

    # CRITICAL: ALB must speak HTTP/2 to gRPC services.
    # Without this, ALB falls back to HTTP/1.1 and every connection
    # silently dies with what looks like a network error.
    protocol_version=elbv2.ApplicationProtocolVersion.GRPC,

    health_check=elbv2.HealthCheck(
        protocol=elbv2.Protocol.HTTPS,
        path="/grpc.health.v1.Health/Check",
        # Standard gRPC OK status code. gRPC returns 200 at the HTTP
        # layer for everything — health status is in the gRPC trailer.
        healthy_grpc_codes="0",
    ),
    target_type=elbv2.TargetType.IP,
)
Forget either of these two lines, and every gRPC connection to your services dies with ECONNRESET or some equally cryptic network error. The ALB defaults to HTTP/1.1, your services answer in HTTP/2 binary, and nobody can figure out why.
I've watched teams lose half a day to this. I want you to never lose half a day to this.
The three Fargate services
Below the ALB, three small Fargate services: inventory, pricing, and fraud. Each one is a Python container running on ARM64 with 256 CPU units (a quarter of a vCPU) and 512 MB of memory. They speak gRPC over HTTP/2, with standard grpc.health.v1.Health endpoints for the ALB's health checks.
Three separate services, not one consolidated service. They have separate scaling profiles — the fraud service is CPU-bound, the inventory service is I/O-bound. They have separate IAM scopes — the fraud service reads no database at all, the inventory service has read-write access to its own DynamoDB table only. They deploy independently. They can be written by different teams.
This is what people actually mean when they say "microservices" — services that are genuinely independent. Not just one codebase with subdirectories.
VPC endpoints — the line item most people miss
On the right side of the architecture diagram is a panel listing VPC endpoints: DynamoDB, ECR, CloudWatch Logs, SSM, X-Ray, STS. Six endpoints in total.
These exist because of a fact most people don't notice until they get a surprising AWS bill. By default, when something inside your VPC calls a service like DynamoDB, the call leaves the VPC, goes out through the NAT Gateway, comes back into AWS, and reaches DynamoDB. You pay for every byte that traverses the NAT.
With VPC endpoints, those calls stay inside AWS's internal network and never touch the NAT. The Gateway endpoint for DynamoDB is free. The Interface endpoints for ECR, CloudWatch Logs, SSM, X-Ray, and STS each cost about \(8/month in eu-central-1. Six endpoints, ~\)40/month total — but they save you NAT data-processing charges and reduce blast radius if your NAT ever has issues.
Worth it every time.
Cost reality
One NAT Gateway. Three Fargate tasks. Two Lambdas. Three DynamoDB tables (pay-per-request mode). Two CloudFront distributions. Six VPC endpoints. A handful of log groups.
If you leave the whole thing running 24/7, it costs about €70–80/month. The NAT Gateway alone is ~€35 of that — a single-AZ NAT, not HA, which is the cost-correctness trade-off for a teaching demo. For production, you'd deploy one NAT per AZ for high availability and pay more for it.
make destroy cleans the entire stack up in about three minutes. I'd recommend running it as soon as you're done exploring.
Demo 1 — REST at the public edge
The first demo is the easiest to overlook and the most important to internalize. It's about why REST belongs at the public edge of your system.
I run make demo-cache, which fires k6 at the REST endpoint for thirty seconds:
$ make demo-cache
Running load test against GET /products/123 ...

scenarios: (100.00%) 1 scenario, 50 max VUs, 30s max duration
default: Up to 50 looping VUs for 30s over 2 stages

✓ status is 200
✓ response time < 200ms

requests..............: 2847   94.9/s
http_req_duration.....: avg=18.2ms p(95)=42.1ms
Same product, hit a hundred times a second for thirty seconds.
Now here's the interesting part. Open the CloudWatch CacheHitRate chart for the CloudFront distribution and watch what happens.
The first few requests miss the cache — CloudFront has no idea what product 123 is. But once it does, every request after that comes straight back from CloudFront's edge locations. Within fifteen seconds you're at 50% cache-hit ratio. Within thirty seconds you're above 80%.
Look at the Lambda Invocations chart at the same time.
Almost flat. A hundred requests a second hitting the public API, and my actual Lambda code barely runs. CloudFront is doing the work — and the only reason CloudFront can do that work is because the REST endpoint sets one specific header:
@app.get("/products/{product_id}")
async def get_product(product_id: str):
    product = await fetch_product(product_id)
    return JSONResponse(
        content=product.dict(),
        headers={"Cache-Control": "public, max-age=60"}
    )
One header. Sixteen bytes. And my origin doesn't have to scale.
This is what people mean when they say REST is built for the public edge. You don't configure it to be cacheable — it's cacheable by default. Every CDN in the world knows how to handle GET requests with JSON responses and Cache-Control headers, because that's been the web's basic contract for twenty-five years.
Try this with GraphQL and the request is a POST that nothing caches. Try it with gRPC and the request is binary that nothing understands. REST gets caching for free, and giving that up is the cost of every other protocol choice.
Demo 2 — gRPC inside the network
The second demo is about why gRPC belongs inside the network, not outside.
I run make demo-payload, which makes the same logical request two ways and prints the byte counts side by side:
┌─── REST (JSON) ──────────────────────┐  ┌─── gRPC (Protobuf) ───────────┐
│ HTTP/1.1 200 OK                      │  │ HTTP/2 200 (gRPC OK)          │
│ Content-Type: application/json       │  │ content-type: application/grpc│
│ Content-Length: 384                  │  │                               │
│                                      │  │                               │
│ {                                    │  │ <0x00 0x00 0x00 0x00 0x4e ...>│
│   "product_id": "p-123",             │  │                               │
│   "name": "Widget",                  │  │ 78 bytes                      │
│   "available": 47,                   │  │                               │
│   "currency": "EUR",                 │  │                               │
│   "price_minor": 1499,               │  │                               │
│   ...                                │  │                               │
│ }                                    │  │                               │
│                                      │  │                               │
│ Total: 384 bytes                     │  │ Total: 78 bytes               │
└──────────────────────────────────────┘  └───────────────────────────────┘

  Binary is 4.9× smaller (79.7% reduction)
Three hundred and eighty bytes versus seventy-eight. About five times smaller. And that's a small message — on larger ones, the gap widens.
The reason is that JSON repeats every field name on every response. "product_id" appears as 12 characters of overhead, every time, on every message. Protobuf doesn't carry field names at all — it carries field numbers, which are encoded in a single byte. The schema (the .proto file) tells both sides what each number means.
Here's the relevant Protobuf definition:
syntax = "proto3";
package orderflow.inventory.v1;

import "orderflow/common/v1/types.proto";

message CheckStockRequest {
  string product_id = 1;
}

message CheckStockResponse {
  string product_id = 1;
  int32 available = 2;
  orderflow.common.v1.Money price = 3;
}

service InventoryService {
  rpc CheckStock(CheckStockRequest) returns (CheckStockResponse);
}
Compact and strongly typed. Both ends generate code from this file — the server gets stub classes to implement, the client gets stub classes to call. No JSON parsing, no field-name strings flying over the wire, no runtime type checking.
Now — for a single request from a phone to a server across the internet, this difference is invisible. Network latency dominates everything. Nobody notices a few hundred bytes saved when the round-trip is 200ms anyway.
But these are services inside the same data centre, talking to each other thousands of times a second. Multiply five-times-smaller by a thousand requests per second across a hundred services, and the savings stack into real CPU, real bandwidth, and real money. Plus the compile-time type safety: if I add a field on the server, the client's build breaks until I regenerate stubs. JSON gives me none of that.
That's why the cooks talk in shorthand. They're standing five feet apart, they're going to say the same thing ten thousand times today, and they need every cycle they can spare.
Demo 3 — GraphQL aggregation in the middle
The third demo is where GraphQL earns its place. It's about what happens when one client needs data from many sources at once.
The OrderFlow frontend has a merchant dashboard that shows, in one screen, an order with its customer, its line items, its pricing, and its fraud score. Four pieces of data, four different backends.
Done the REST way, this is four sequential API calls:
// First, get the order
const order = await fetch(`/api/orders/${orderId}`).then(r => r.json());

// Then the customer it belongs to
const customer = await fetch(`/api/customers/${order.customer_id}`)
                       .then(r => r.json());

// Then the items
const items = await fetch(`/api/orders/${orderId}/items`)
                       .then(r => r.json());

// Then the fraud score
const fraud = await fetch(`/api/orders/${orderId}/fraud`)
                       .then(r => r.json());
Each call waits for the previous one. Total time: ~600ms.
Done the GraphQL way, the same data comes back in one round-trip:
query MerchantDashboard($orderId: ID!) {
  order(id: $orderId) {
    id
    status
    total { amount currency }
    customer { id name email }
    items { productId name quantity unitPrice { amount } }
    fraudAssessment { score recommendation }
  }
}
One request. One response. About 180ms.
What happens inside? The GraphQL Lambda receives the query, parses it, and works out that it needs three different backing services. It then fires three gRPC calls in parallel to the inventory, pricing, and fraud services. They all return in roughly the same time. The Lambda composes the results into a single response shaped exactly like what the dashboard wanted.
Same data. One quarter of the wait.
This is the GraphQL win, and it's a real one. On a mobile network where every round-trip costs you 100ms of latency, the difference between four sequential calls and one combined call is the difference between a dashboard that feels snappy and one that feels broken.
Demo 4 — The N+1 trap
But GraphQL has a catch. And if you're going to use it, you have to know what the catch is.
The same query I just showed can be implemented two ways on the server. The naive way works fine for one user. The naive way is also catastrophic at scale.
I run make demo-n-plus-one, which executes the same query twice — once in naive mode, once with DataLoader batching:
═══════════════════════════════════════════════════════════
Run 1: ?naive=true (no DataLoader)
═══════════════════════════════════════════════════════════
  resolver_calls: 18
  grpc_calls:     18
  total_time:     412ms

═══════════════════════════════════════════════════════════
Run 2: DataLoader mode (default)
═══════════════════════════════════════════════════════════
  resolver_calls: 18
  grpc_calls:      3
  total_time:     147ms

═══════════════════════════════════════════════════════════
DataLoader reduced gRPC calls by 6.0×
═══════════════════════════════════════════════════════════
Eighteen gRPC calls become three. Same query. Same response.
This is the N+1 problem. The naive resolver implementation fires one gRPC call per field per row. Five items in the order? Five separate gRPC calls to fetch each item's name. Need pricing for each? Five more calls. The total balloons proportionally to how nested and how wide the query is.
The fix is a pattern called DataLoader, which batches calls inside a single GraphQL request. Here's what it looks like in Strawberry:
from strawberry.dataloader import DataLoader

async def load_products(product_ids: list[str]) -> list[Product]:
    # Single batched gRPC call to fetch all products at once
    response = await inventory_client.BatchGetProducts(
        BatchGetProductsRequest(product_ids=product_ids)
    )
    return list(response.products)

# DataLoader collects all product_id keys requested during a single
# GraphQL request, then makes one gRPC call to fetch them all at once.
product_loader = DataLoader(load_fn=load_products)

@strawberry.type
class Item:
    product_id: str

    @strawberry.field
    async def product(self) -> Product:
        # This LOOKS like a per-row call, but DataLoader batches all
        # such calls in the same request into one gRPC call.
        return await product_loader.load(self.product_id)
The trick is that DataLoader doesn't execute immediately. It collects every .load() call during a single GraphQL request, deduplicates the keys, and fires a single batched call when the resolver chain finishes its synchronous work. The application code looks naive. The runtime behaviour is batched.
If you take one thing about GraphQL from this post, take this: GraphQL gives the client a lot of power to ask for whatever they want. The server has to be careful not to take that power literally. Plan for DataLoader from day one, or you'll be rewriting half your backend in year two.
The decision rule
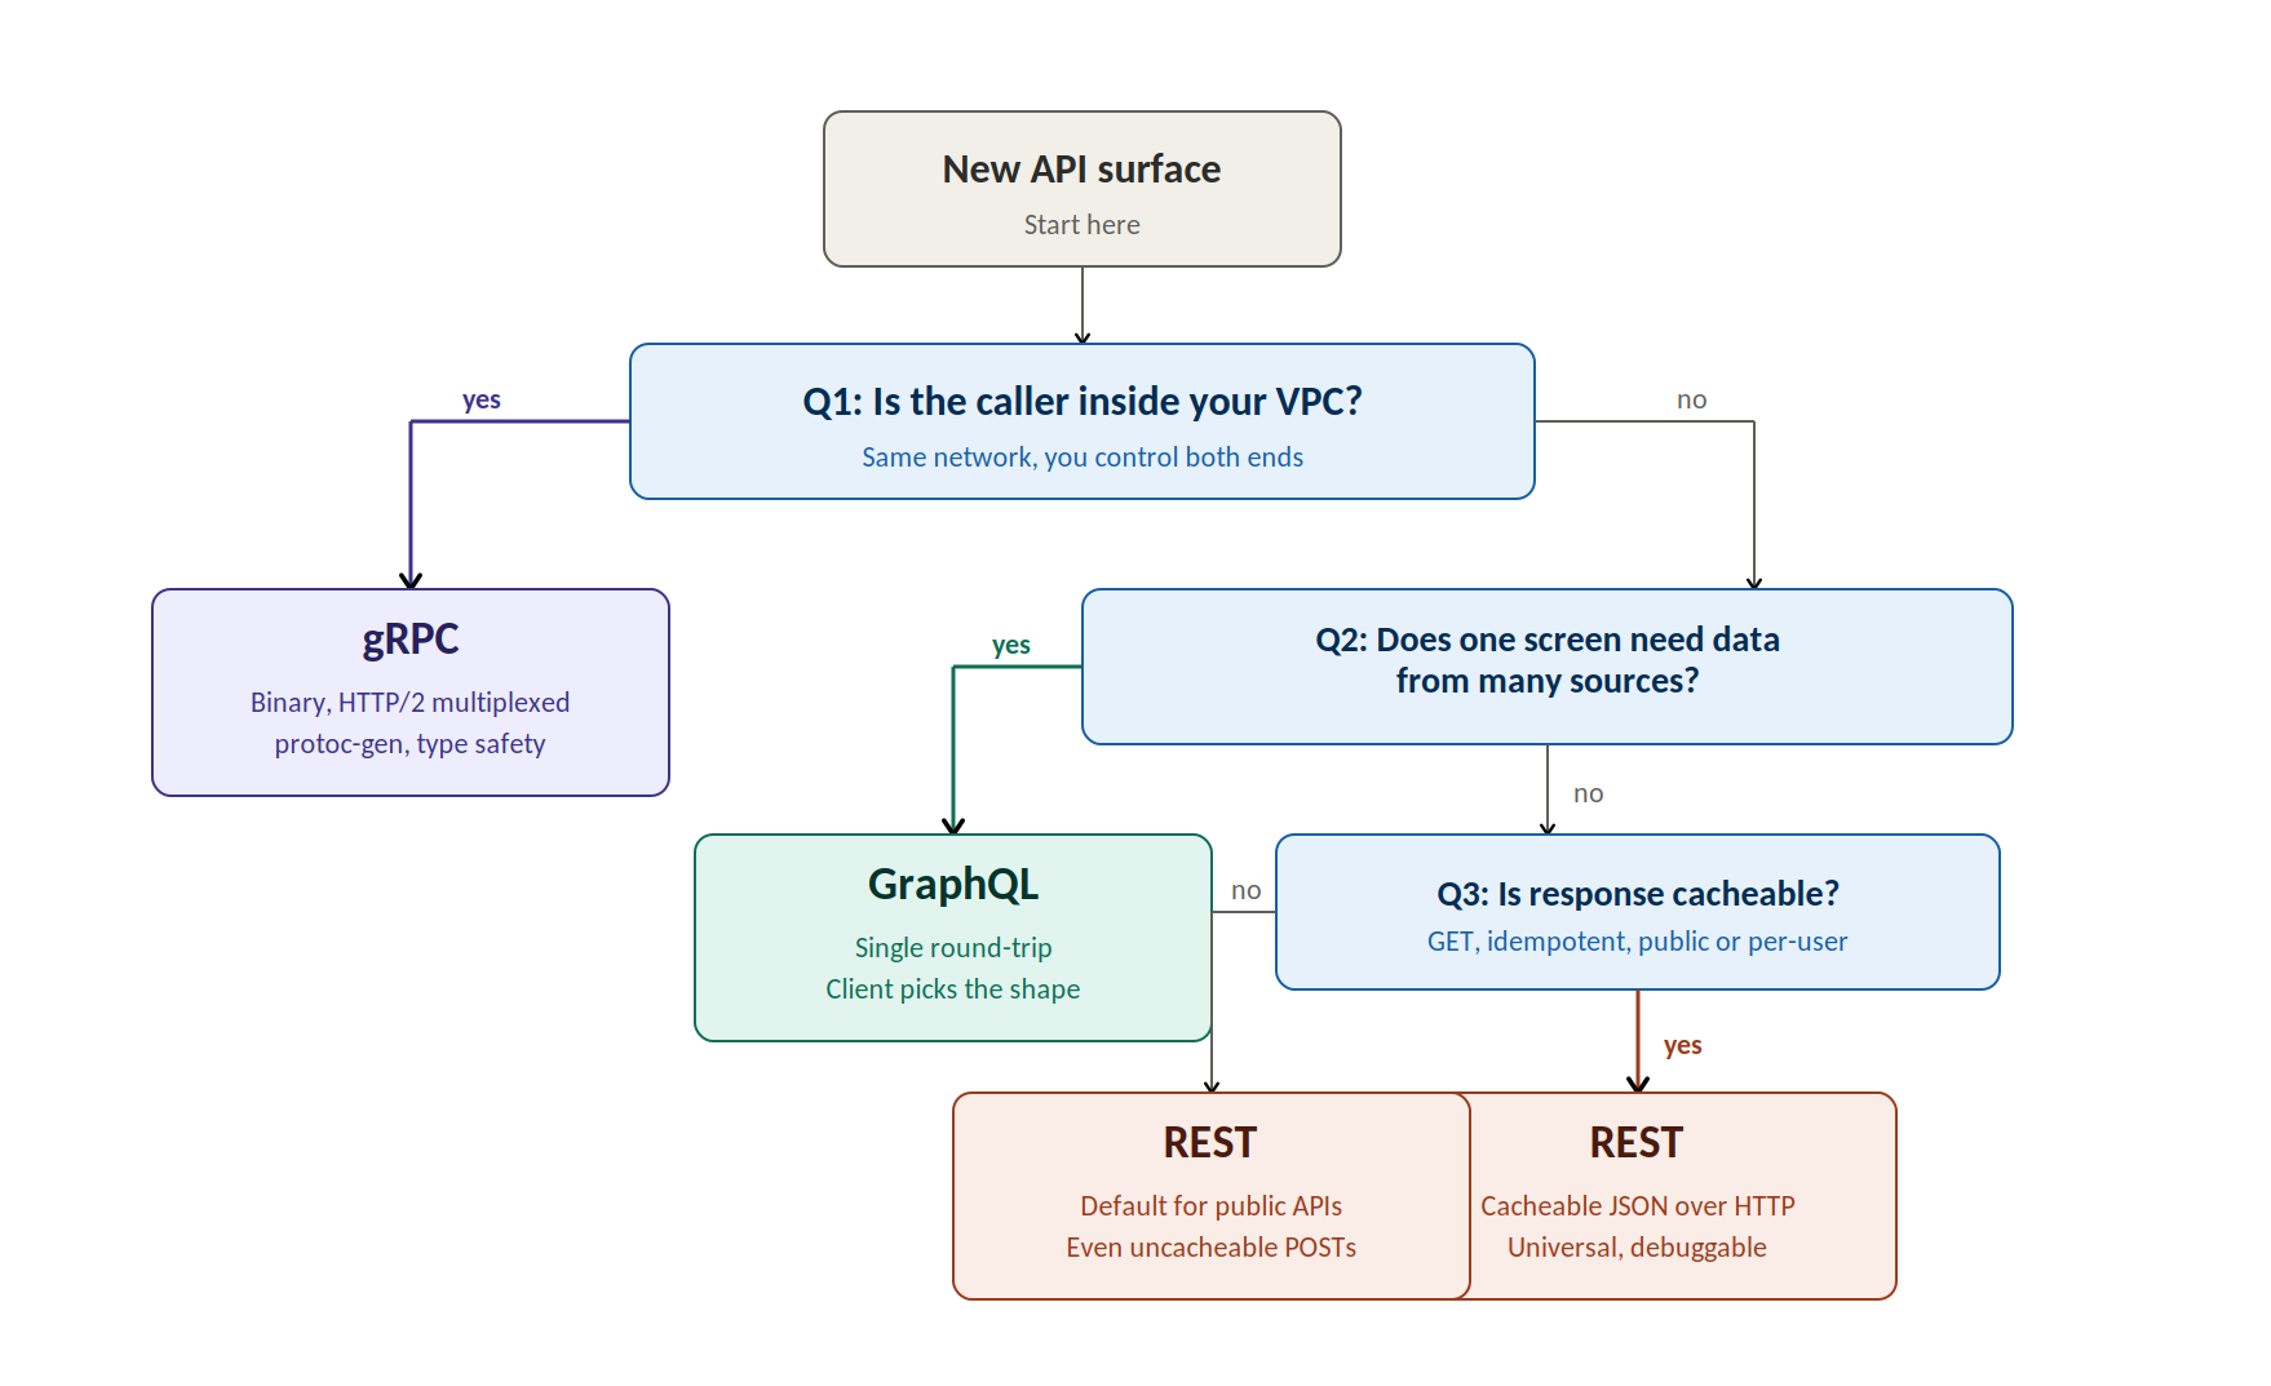
So you've seen the four demos. Each one shows a protocol in its right place — and shows what happens when you put it in the wrong place. Now here's the rule, distilled into three questions you ask in order:
Q1: Is the caller inside your VPC? If yes → gRPC. You're the cooks in the kitchen.
Q2: Does one screen need data from many sources? If yes → GraphQL. You're the waiter taking the whole order.
Q3: Everything else. → REST. You're at the counter. JSON over HTTPS, cacheable, debuggable, universal.
REST is your default. The other two are exceptions you reach for when you have a specific reason. If you find yourself defaulting to GraphQL for every new endpoint because it's flexible, or to gRPC because it's fast — you're picking by feel, not by who's talking to whom. Catch yourself, ask the three questions, and let the protocol pick itself.
A few clarifications on the rule:
"Inside your VPC" is the network boundary, not the org boundary. Even if the same team writes both ends, if the caller is a browser or mobile app, it's not in your VPC. REST or GraphQL.
GraphQL isn't only for "rich UIs." Any client that pulls related data from multiple sources fits. A mobile app's home screen, a CLI tool that aggregates a status report, a CI/CD dashboard widget.
gRPC works fine across regions if both regions are yours. "Inside your VPC" is shorthand for "inside your trust boundary." VPC peering, Transit Gateway, AWS-internal networks — they all count.
REST is a spectrum, not a point. Pure HATEOAS REST is one end, pragmatic JSON-over-HTTP is the other. Most production "REST" APIs sit somewhere in the middle. The rule still applies.
You're going to design a new API endpoint this week. Or next week. And when you sit down to do it, your first instinct will be to copy the protocol from the last endpoint you built.
That instinct is wrong about a third of the time.
The question isn't "what did we use last time." The question is "who's talking to whom, and what do they actually need." Ask that question once, before you write the first line of code, and you'll never confuse the answer for the protocol again.
That's the whole thing. The rest of the post is just receipts.
Try it yourself
🔗 Full source code: github.com/easyharshmods/api-protocol-playground
The whole project deploys to your AWS account in about 15 minutes with make deploy. Costs about €70/month if you leave it running, and make destroy cleans the whole thing up.
If you clone it and build something on top of it, I'd genuinely love to hear about it. Drop a comment below or find me on LinkedIn
What I deliberately didn't build
Before someone asks in the comments: a few things this project explicitly does not include, and why.
No authentication. No Cognito, no API keys, no OAuth. This is a teaching demo, and adding auth would obscure the protocol comparison. Production would have all of it.
No CI/CD. No GitHub Actions, no CodePipeline, no CDK Pipelines. Deployment is via local CLI with
make deploy. Adding a pipeline didn't earn its complexity for the audience this is for.No multi-region. Single region (eu-central-1). HA across AZs only.
No WAF, Shield, or advanced security controls. Out of scope.
No real PKI. The internal ALB uses a self-signed cert imported into ACM and bundled into the Lambdas as a custom CA. For production, AWS Private CA is the right answer.
These omissions are deliberate. The project is meant to be readable and deployable in an afternoon, not to be production-ready. If you fork it and harden it for real use, those are the gaps to fill first.
What's next
I'm working on the next piece for Platform Intelligence — same shape (a working AWS reference + the architectural reasoning behind it), different topic. If you want to know when it goes live, the YouTube channel and this blog are the two places it'll show up first.
Until then — build something. Ask the question. And tell me what you found.


